Precipitation
Monthly satellite rain-rate estimates calibrated with rain gauges, summed over complete 12-month calendar years.
DOI: 10.5067/GPM/IMERG/3B-MONTH/07NASA SPACE APPS · EARTH SYSTEM TREND DETECTIVE
Is the Earth changing where you live? 25 years (2000–2024) of monthly NASA satellite & land-model observations across six regions.

OBSERVED VARIABLES & FIELD REGIONS · 2000–2024
Six area-averaged observation boxes chosen by data rather than climate stereotypes — even a wet rainforest can dry significantly while a semi-arid belt wets. Each region is evaluated across three NASA Earth-science variables:
Monthly satellite rain-rate estimates calibrated with rain gauges, summed over complete 12-month calendar years.
DOI: 10.5067/GPM/IMERG/3B-MONTH/07Water stored in the top 10 cm of soil, modelled by the GLDAS Noah Land Surface Model fed with satellite observations.
DOI: 10.5067/SXAVCZFAQLNOMonthly mean temperature of the air two meters above the ground from the MERRA-2 global reanalysis.
DOI: 10.5067/AP1B0BA5PD2KSTATISTICAL RIGOR · WHY THIS MATTERS
A short 25-year window can fool standard regressions when El Niño or soil memory links one year to the next. Atlalli applies a strict protocol across all 18 series.
Reports the median rate of change per decade with a 95% confidence interval, remaining resistant to extreme drought or flood outlier years.
Tests monotonic trends and switches to Hamed-Rao variance correction whenever positive lag-1 serial correlation exceeds 0.20.
All 18 planned comparisons (3 variables × 6 regions) are corrected together so random fluctuations are not misreported as discoveries.
LEARN MORE · OPEN SOURCE REPOSITORY
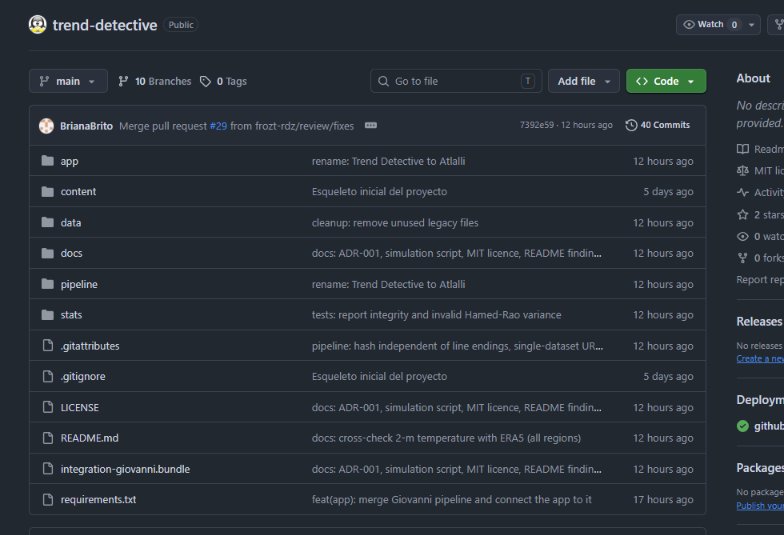
All source code, the NASA Giovanni ingestion pipeline, non-parametric statistical tests, and this web atlas are publicly available on GitHub under the MIT License for full scientific reproducibility.